See this week’s crews — and where you’ll be short before the GC asks.
A live weekly grid by foreman and package, with Day Mode when crews pivot mid-week. Projection plus a manpower-gap strip flags surplus, at-capacity, and short weeks against demand. Branded XLSX, per-foreman PDF crew sheets, weekly digest email, full distribution, CSV roster import — and a 4-tier role model that includes a Coordinator who edits the roster but not the schedule.
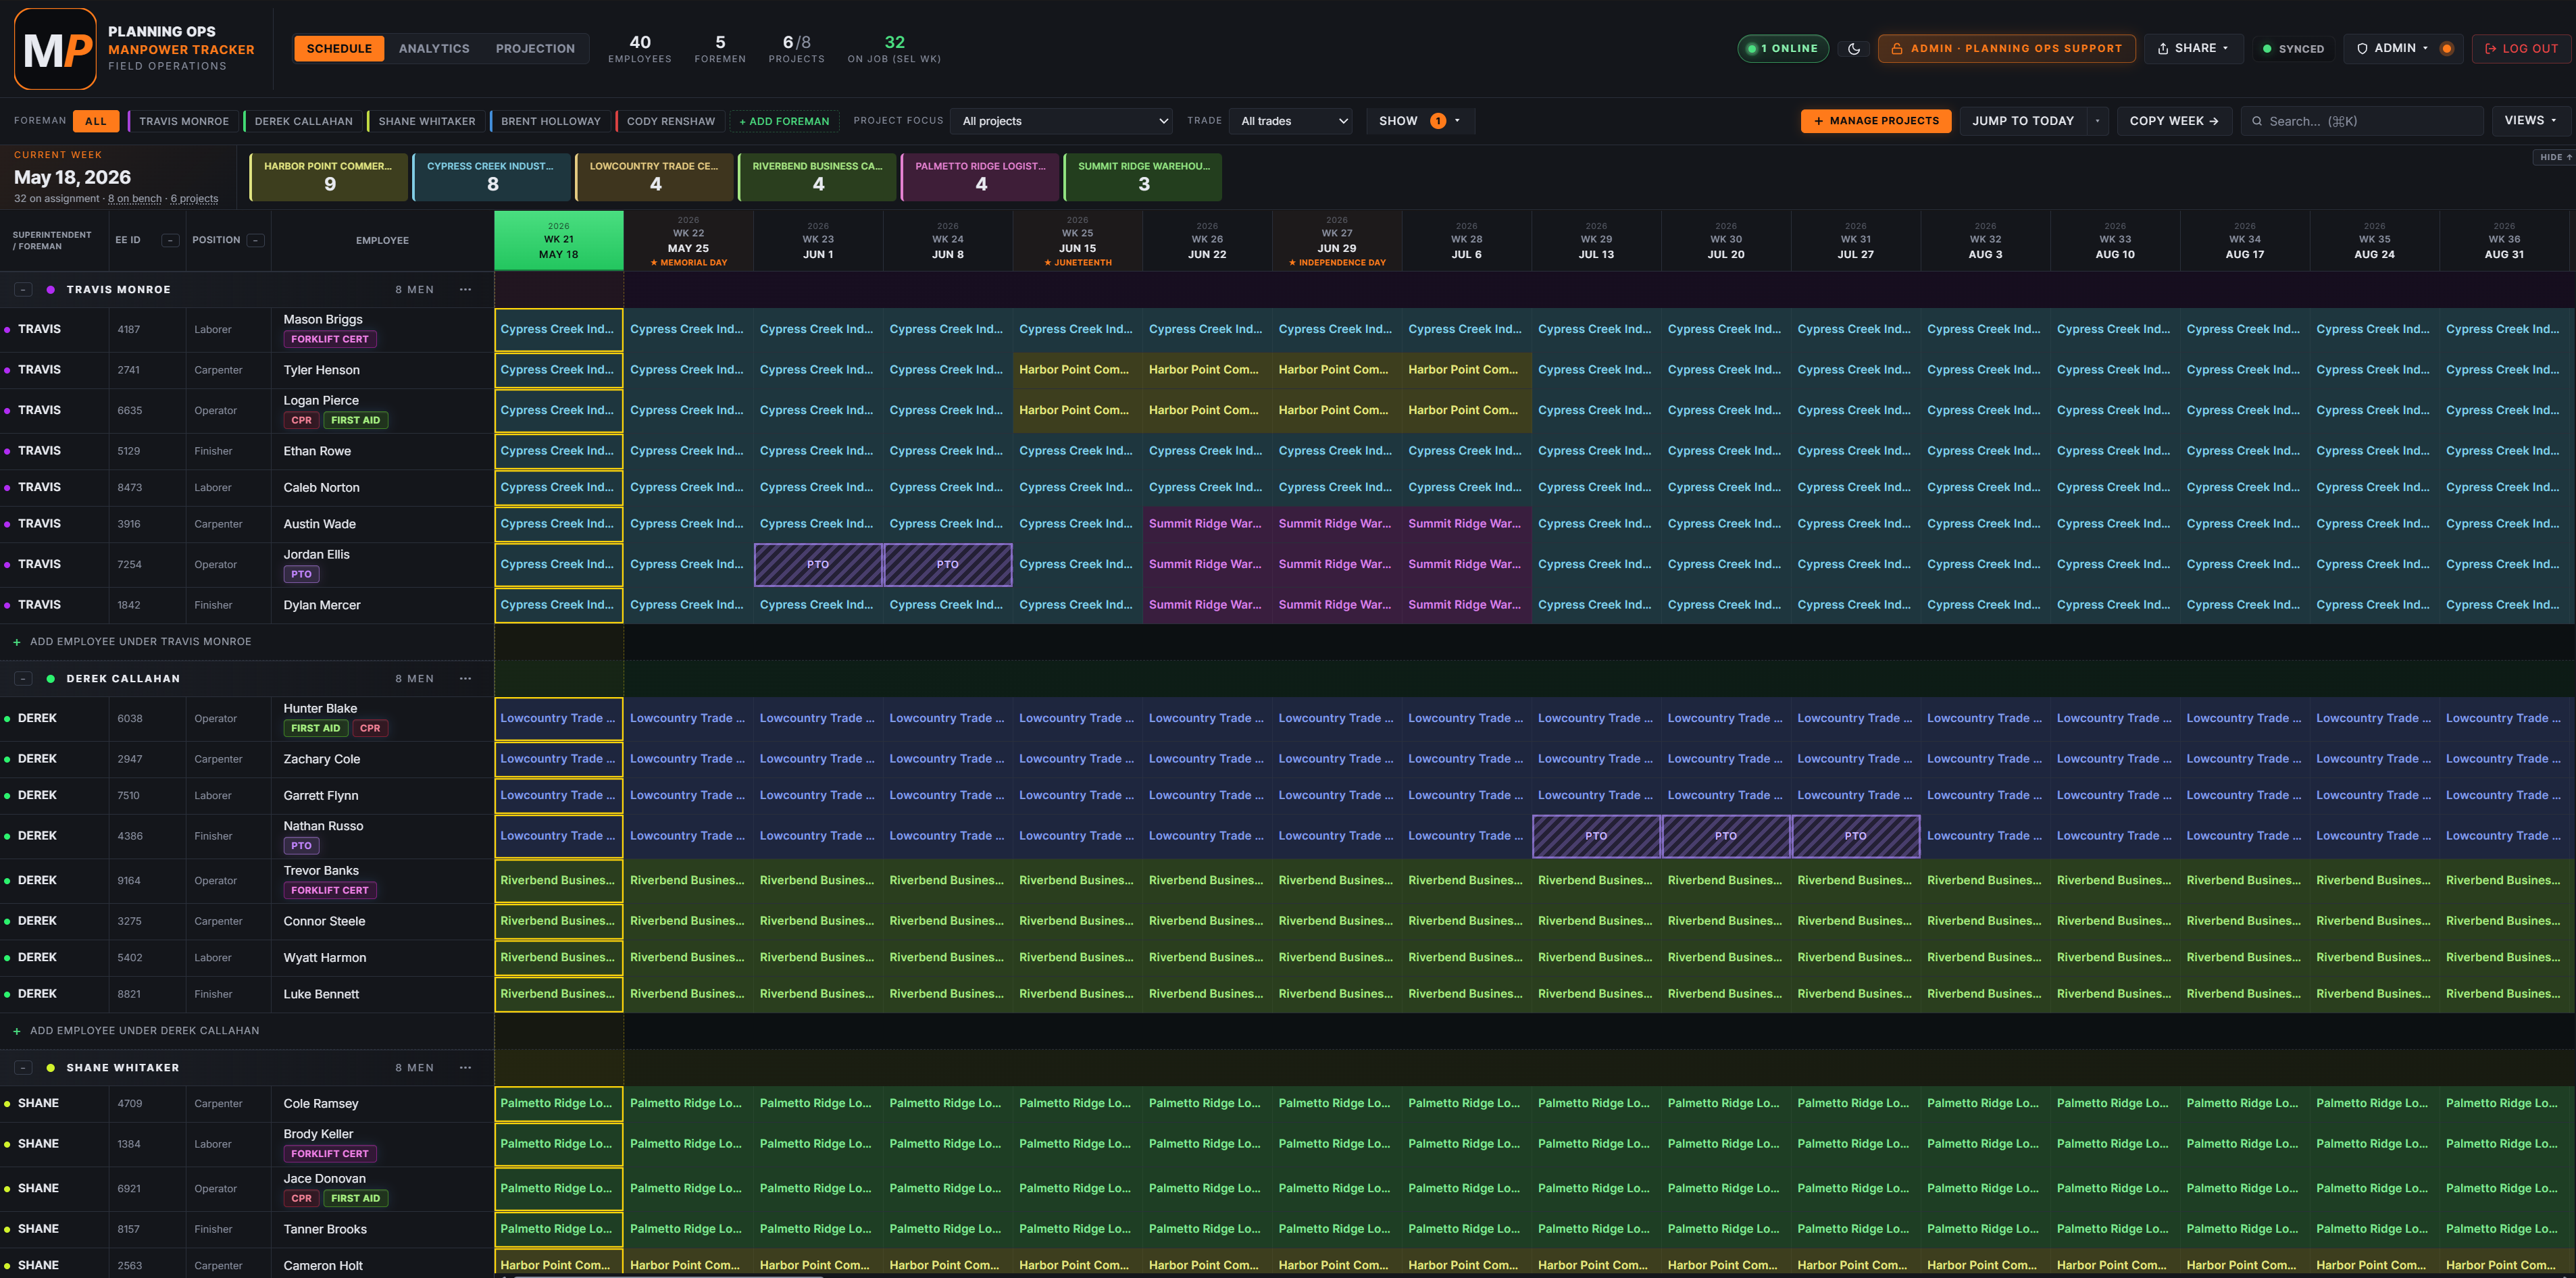
Employees group under their foreman. Click any cell to assign a project for that week. Drag across cells to mass-edit. The orange line marks the current week. Realtime-synced across users — no “is this the latest version?” in email.
Day Mode
Daily granularity inside each week
Crews that pivot mid-week (Mon/Tue on Job A, Wed-Fri on Job B) don’t lose detail. KPI strip splits Day / Week stats, headers show May 11 MON-style labels, and Day-aware analytics + exports keep the granularity in the PDF and XLSX.
Projection + Gap strip
Demand vs scheduled headcount — by week
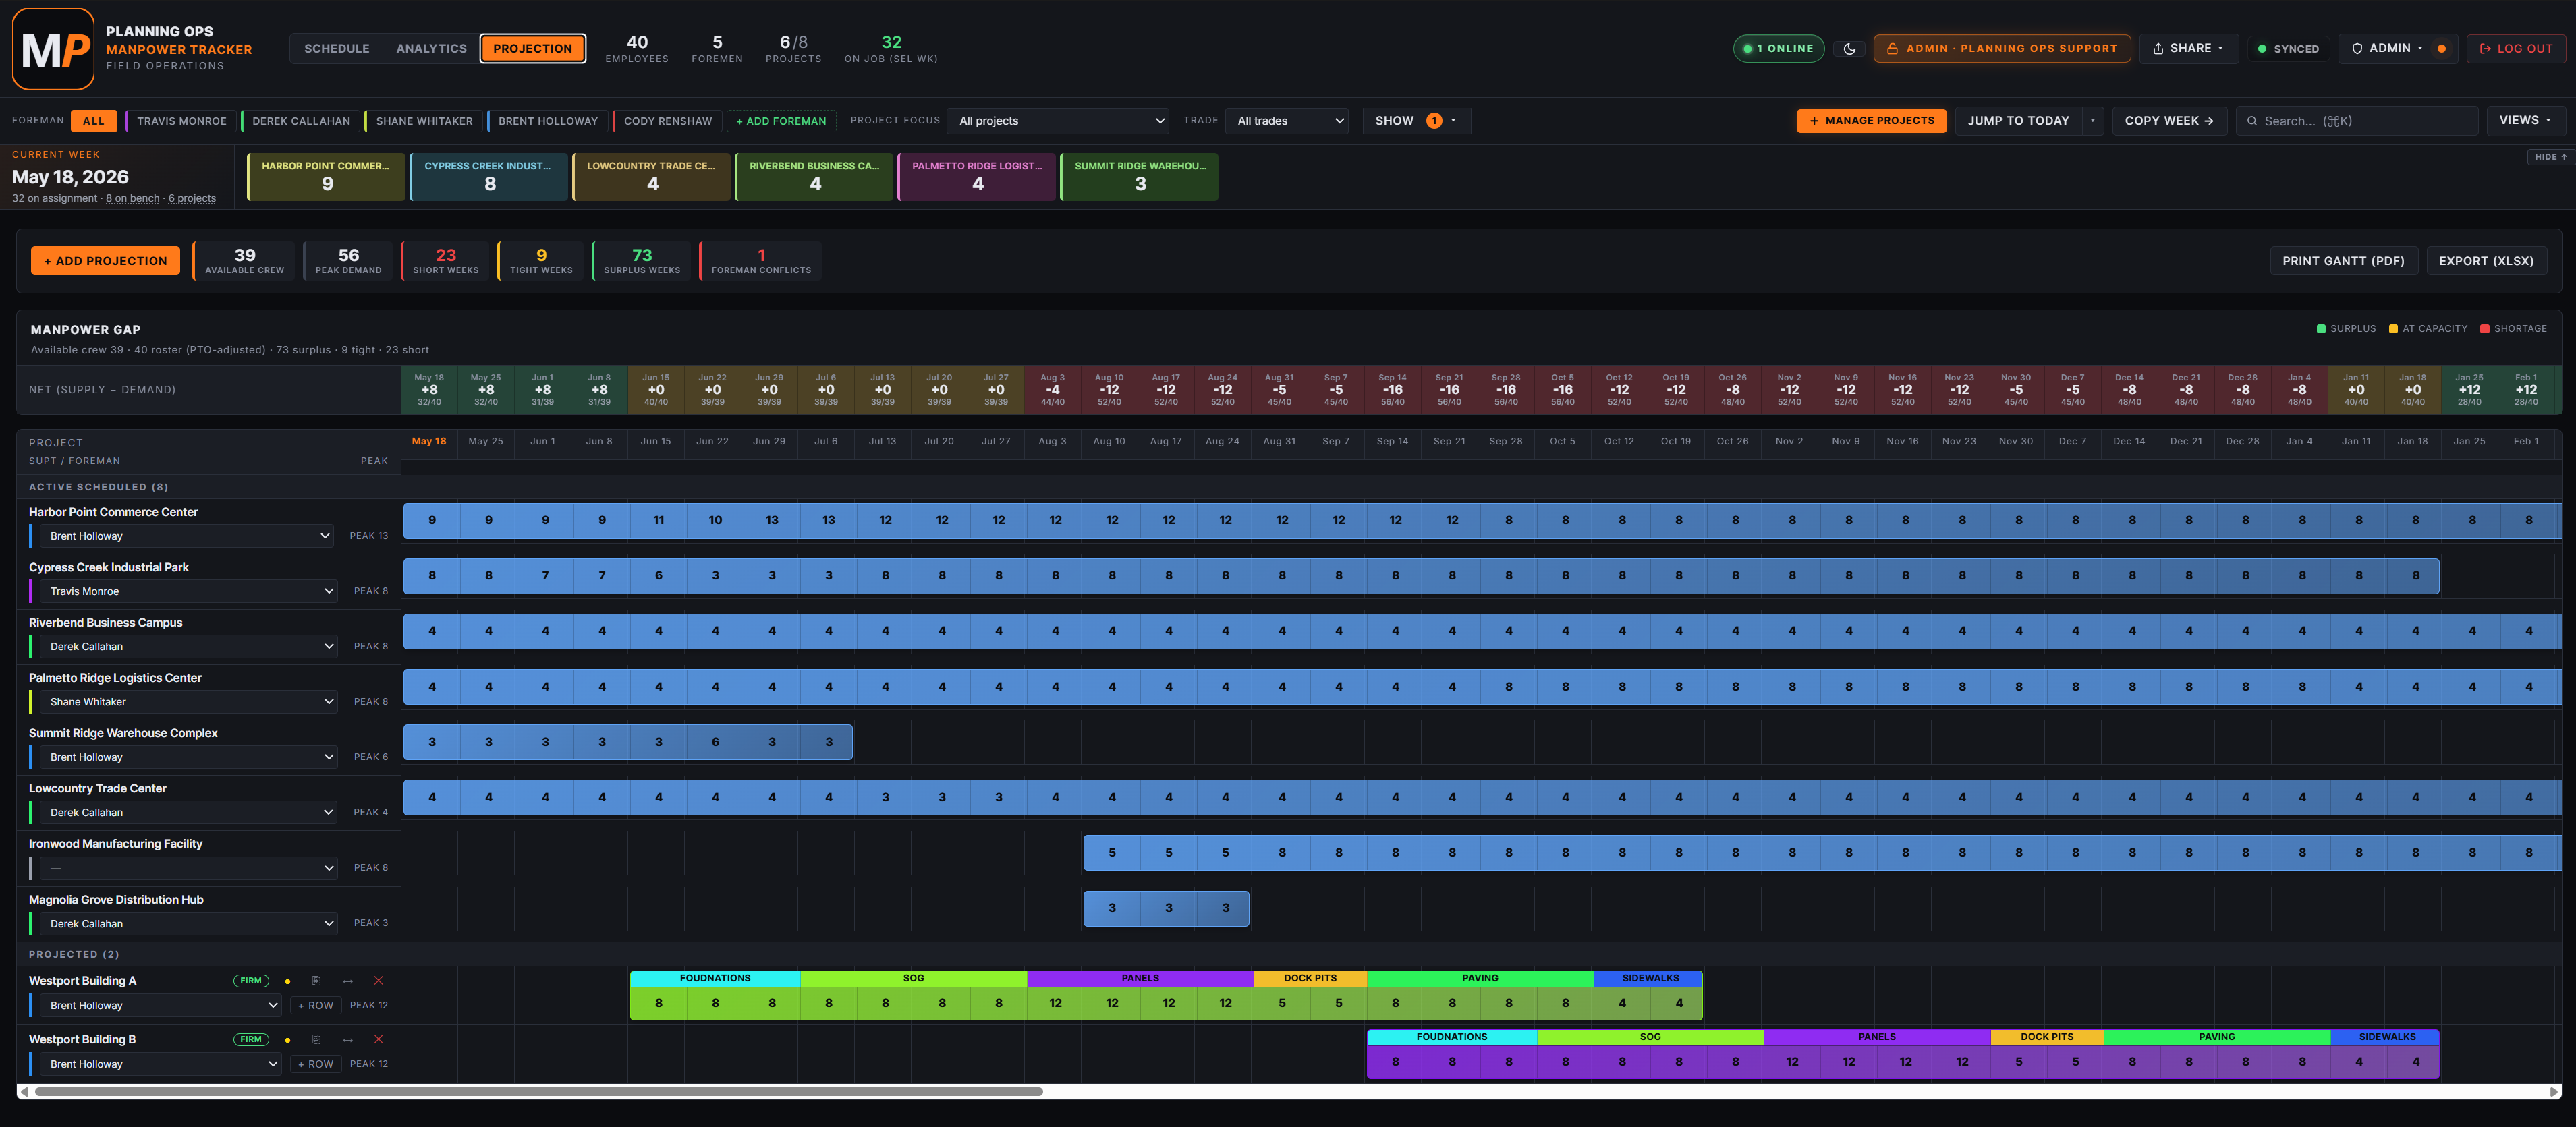
Lay out future jobs and headcount needs. The Projection view sets demand. The Manpower Gap strip compares against the active schedule and flags surplus, at-capacity, and short weeks before overtime hits.
Analytics
KPIs and charts over any range
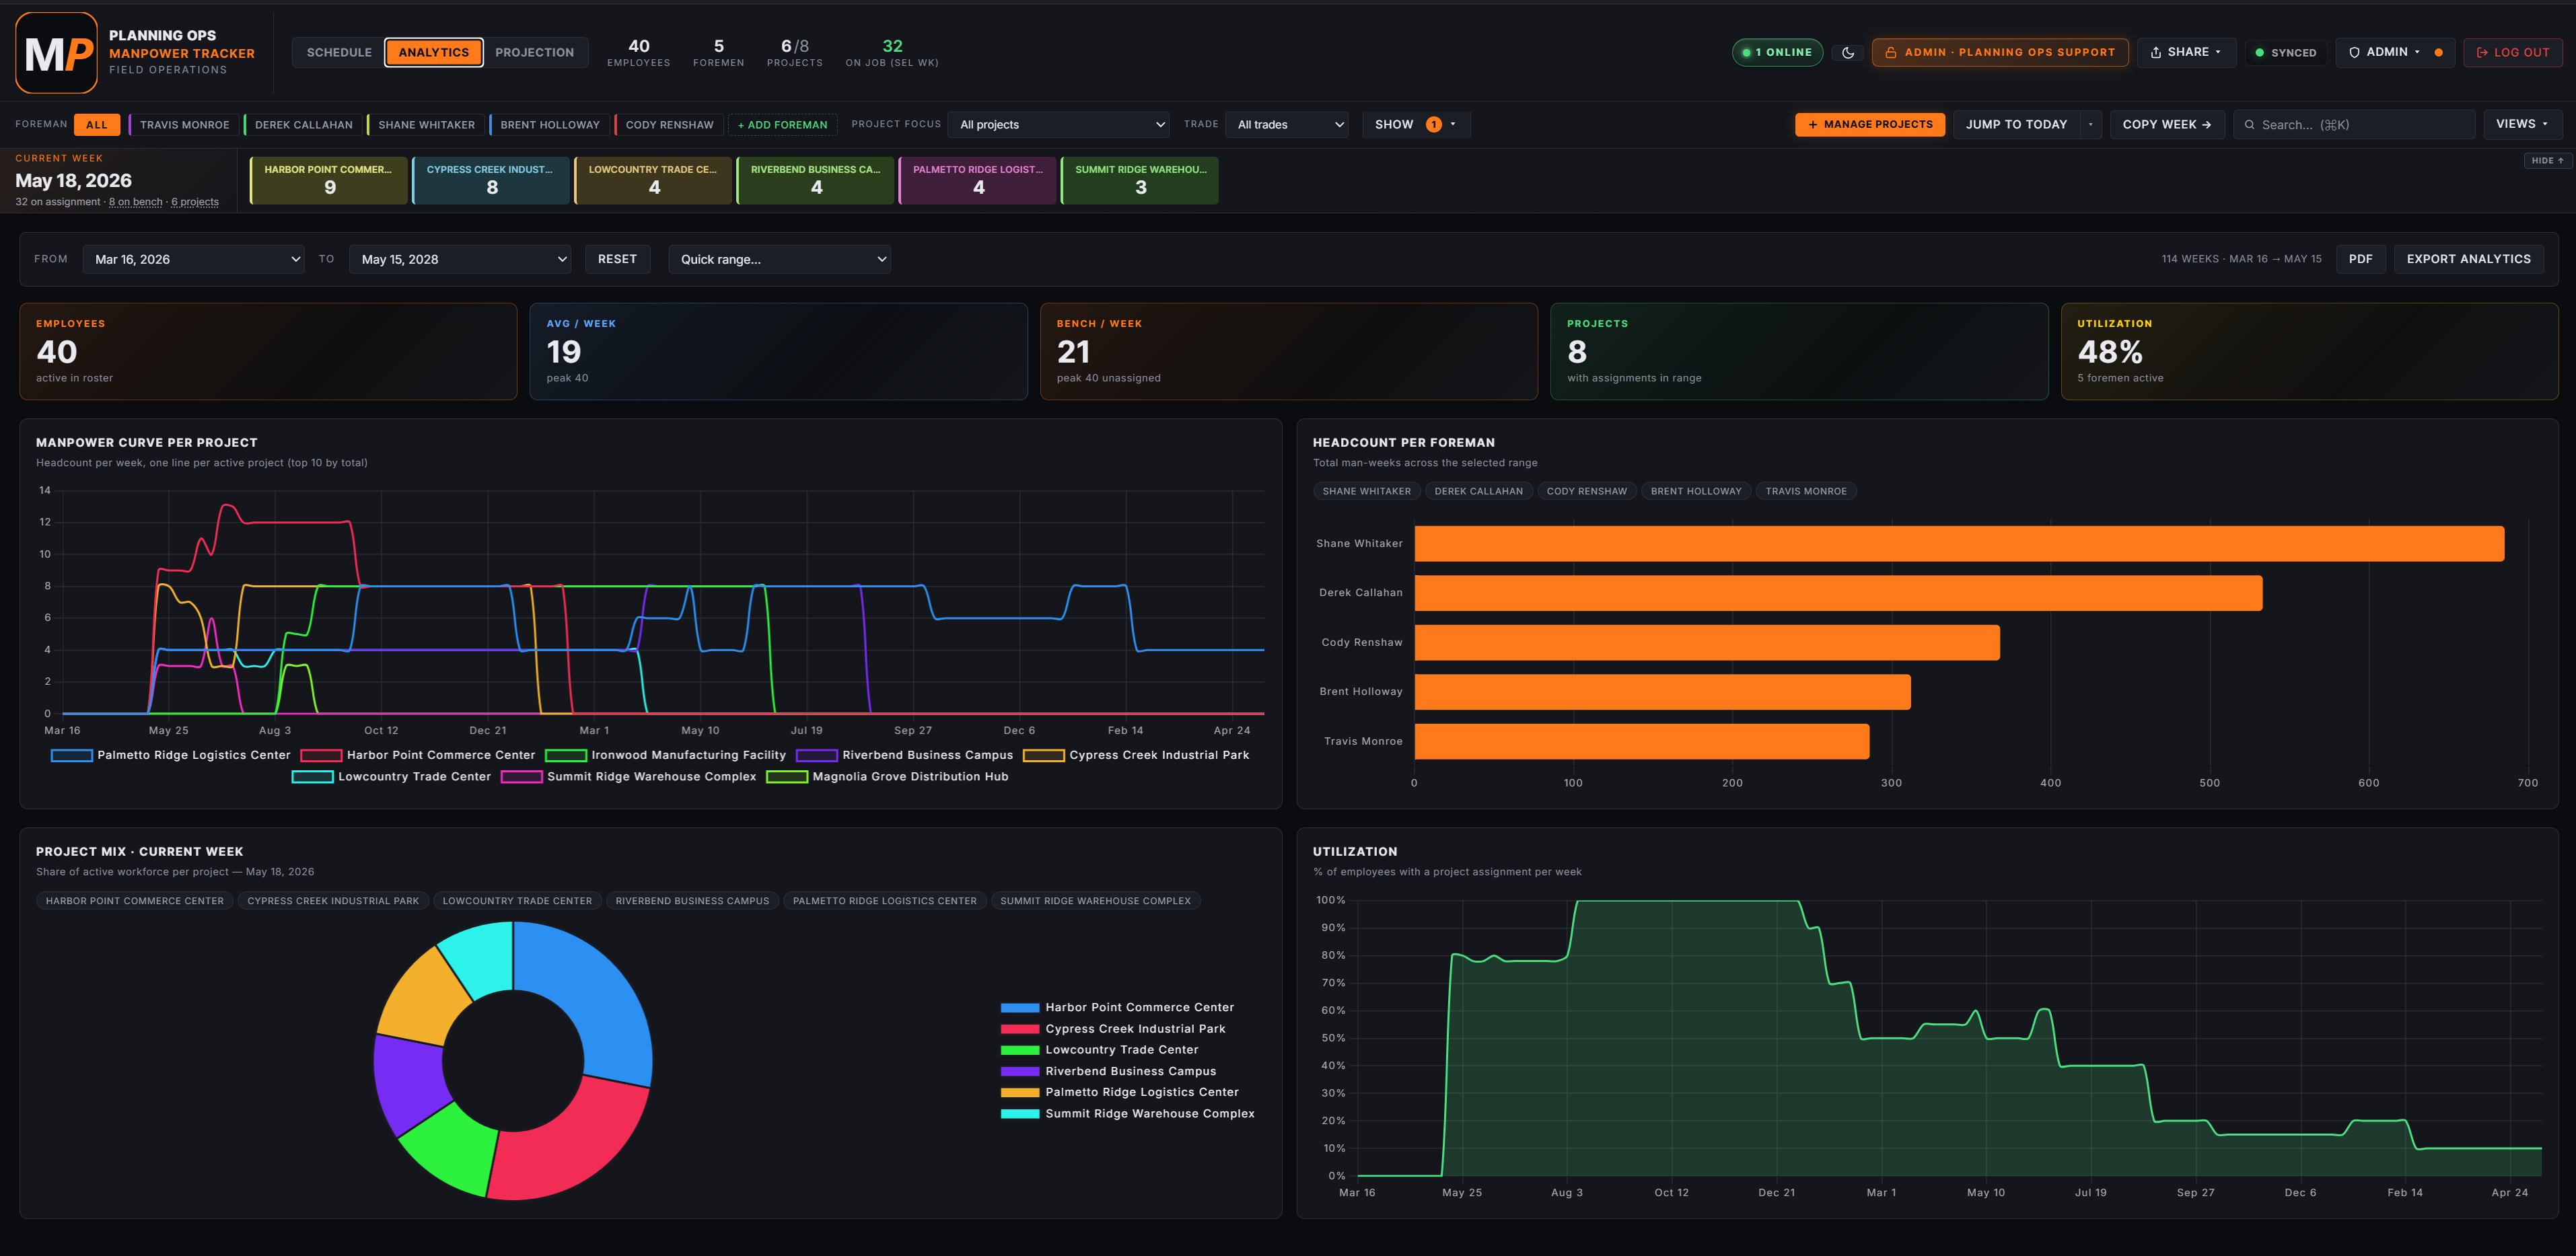
Pick a date range. KPI tiles cover total man-weeks, peak-week headcount, active projects, average utilization. Charts: manpower curve per project, headcount per foreman, project mix, utilization. No analytics paywall — every tier includes them.
Distribution
Five ways to send the schedule out
Export Schedule (Excel) with a branded multi-tab workbook. Print Crew (PDF), one page per foreman for the selected week. Weekly Digest — plain-text “here’s next week” email. Distribute — full schedule emailed with XLSX attached. Auto-digest — set it and forget it.
CSV roster import
Bulk-add crews from a spreadsheet in one pass
Map columns to supervisor / EE ID / position / name. Pull employees and projects from a workbook in one upload — no per-row data entry.
4-tier role model
Admin · Editor · Coordinator · Viewer
Coordinator is the unique one — they edit the roster (add foremen, employees, statuses) but cannot touch the schedule. Perfect for HR / dispatch teams who maintain the directory without owning the week.
Audit log + history
Who did what, when — restorable
Every schedule change is logged with user, timestamp, and the before/after value. Restore from any prior version via the Sync menu → History. CSV export for owner reviews.
Light Mode for projector reviews · Night Mode for the trailer at 5 a.m.
One toggle flips the whole hub between dark and light. Schedule, Analytics, Projection all follow. Every PDF and XLSX export renders in the same palette you see — no surprise color blowups when you open the file with the GC.
See the actual hub
Real product. Real foremen. Not a render.
Captured from a live tenant. The grid, the gap strip, the analytics — exactly as your planning team will see them.
ScheduleThe week grid your superintendents open first. Employees grouped under their foreman with EE IDs, positions, and cert badges (Forklift, CPR, First Aid). Cells show the assigned project per week (or per day in Day Mode). PTO blocks render as labeled purple bands. KPI strip across the top shows project totals at a glance.
ProjectionThe shortage radar. Manpower Gap strip across the top shows every week as surplus (green +), at capacity (amber 0), or shortage (red −) against your available roster. Scheduled jobs render with their weekly headcount; projected jobs get phased strips (Foundations, SOG, Panels, Dock Pits, Paving, Sidewalks). Spot the overtime / rental crunch before the GC asks.
AnalyticsEverything an ops director wants in one screen. KPI tiles: active employees, avg per week, bench per week, projects, utilization %. Charts: manpower curve per project (line), headcount per foreman (bars), project mix (donut, current week), utilization trend (area). Date range picker drives every chart. Branded PDF and XLSX exports for owner reviews.
Pricing
Manpower Seat Bands
Every band is the full product — schedule grid, Day Mode, Projection, Analytics, distribution, roles. You’re only buying how many people you activate.